
Standing at the edge of a plantation block in a village, it was hard to picture how anyone used to keep track of this place before. Rows of saplings stretched across three separate parcels, each belonging to a different farmer, each with its own planting date and survival count. A field officer nearby was still carrying a paper form, and when asked how those numbers would reach the project office, he shrugged and said it usually took a couple of weeks and a fair bit of guesswork.
That gap between what happens on the ground and what ends up in a report is where most climate and agroforestry projects quietly lose credibility. Farmer records, parcel boundaries, tree counts and monitoring visits pile up across different notebooks, phones and spreadsheets, and by the time a registry asks for proof, someone is usually reconstructing history rather than reporting it.
When records fall apart
Fragmented data does not just slow down reporting, it changes what a project can honestly claim. Without a shared system, one officer’s parcel map rarely matches another’s, tree survival figures get rounded off from memory, and monitoring visits go undocumented for months at a time. Entire seasons of field work risk becoming difficult to verify.
But once field data starts flowing into one connected system, the picture shifts quickly. Farmers and their parcels stay linked to a single record. Boundaries drawn on a map match what a surveyor sees while standing at the plot. Growth data updates on a schedule instead of arriving in a rush before a donor deadline.
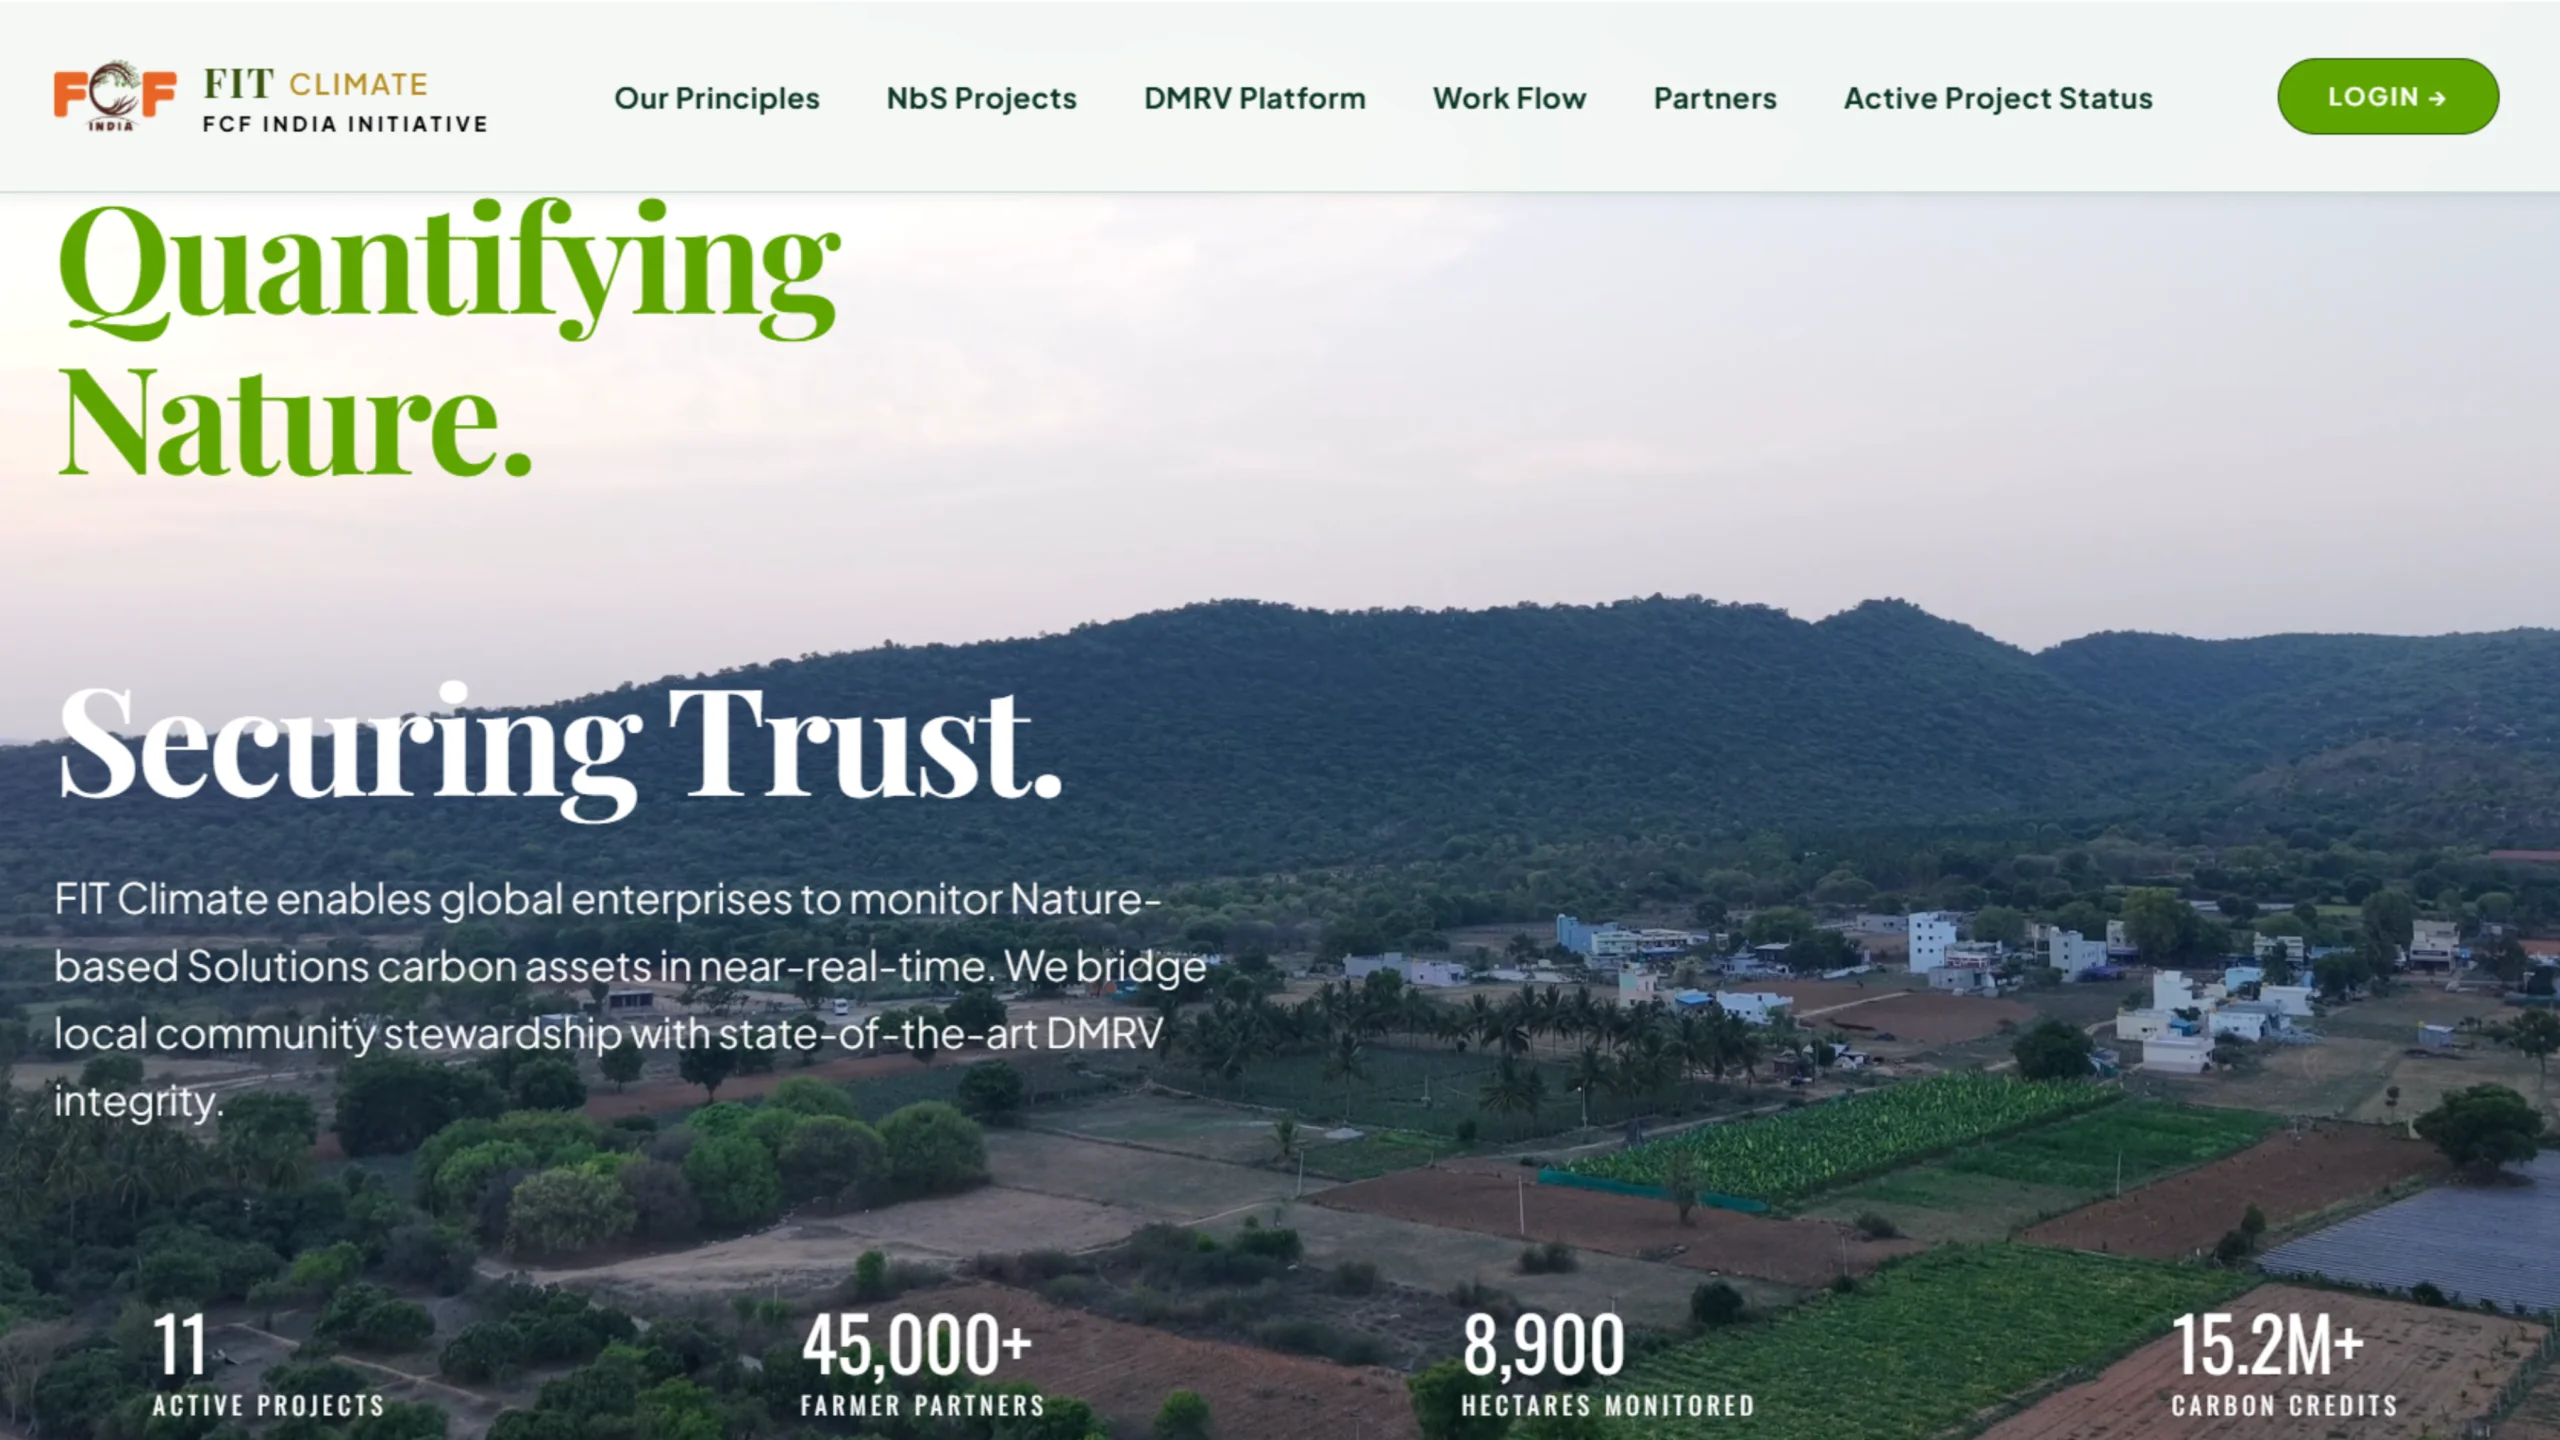
This is the gap the FitClimate, MRV (Measurement, Reporting and Verification) platform is built to close, the three functions any credible carbon or restoration project depends on. Rather than treating these as separate spreadsheets that rarely agree with each other, the platform pulls them into one system that a field officer, a project manager, and an outside auditor can all read from the same source.
The system built to hold it together
Farmer and land parcel records sit at the core, since almost every other layer eventually traces back to a specific person and a specific plot. GIS based mapping lets someone in a Delhi office see a parcel boundary the same way a field officer sees it standing at the edge of the plantation. Drone imagery adds a closer look at canopy cover on larger or harder to reach sites, and tree inventory tools track species, planting dates and growth stages across thousands of trees at once, something no paper register could realistically manage.
Satellite monitoring using NDVI readings from Sentinel-2 imagery fills in what field visits alone cannot cover, tracking vegetation health across an entire project area on a regular cycle without anyone needing to walk every plot each month. Mobile survey tools let field staff log observations directly rather than typing up a paper form weeks later, and dashboards with role based access mean a surveyor sees what they need while a director sees a wider view built from the same underlying records.
Underneath this runs a fairly ordinary but capable set of tools. The front end is built on React, the database runs on PostgreSQL with the PostGIS extension for handling spatial queries properly, and the whole system sits on Google Cloud Platform, using Cloud SQL, Cloud Storage and Cloud Run to keep it running without constant manual upkeep. Google Earth Engine handles the heavier satellite processing, drawing on Sentinel-2 imagery, and together these tools give the platform a reasonable base for GIS and remote sensing work at a scale a spreadsheet simply cannot hold.
More than record keeping
What changes once the friction of manual reporting is removed is not really about the software itself. Project teams can watch plantation growth over time instead of estimating it once a year. They can see how many farmers are still actively participating rather than how many signed up at the start. Geospatial records stay consistent instead of drifting apart across different people’s personal files, and reports for a carbon registry or a funding partner draw on numbers already organised, not assembled under pressure the week before a deadline.
For a carbon project developer in India managing sites across several states, that kind of consistency is close to a basic requirement for staying credible with international registries, not an added convenience.
Work continues on models that would estimate carbon sequestration more directly from field data already being collected, along with broader analytical tools drawing on the monitoring history the platform builds up over each project cycle. Satellite based readings are expected to sharpen as more historical data accumulates, and reporting tools are being extended to keep pace with compliance requirements that registries tighten almost every year.
The first step toward better records
Across projects like this, the pattern holds. Once field data is centralized, planning gets easier, and once planning gets easier, the fieldwork itself becomes more honest about what it has actually achieved.
Projects pursuing nature-based solutions in India are growing in number, and so is the scrutiny attached to them. Systems like this will not replace the officer walking a plot with a measuring tape, and they are not meant to. What they offer instead is a clearer, shared record of what that officer already knows from the ground, one that can stand up when a registry or a partner finally asks for proof. FitClimate’s platform is one attempt at building that record, and it is part of what is beginning to shape India’s top-rated agroforestry project work into something registries can actually trust.